

by Hubert Moolman
Silver Seek
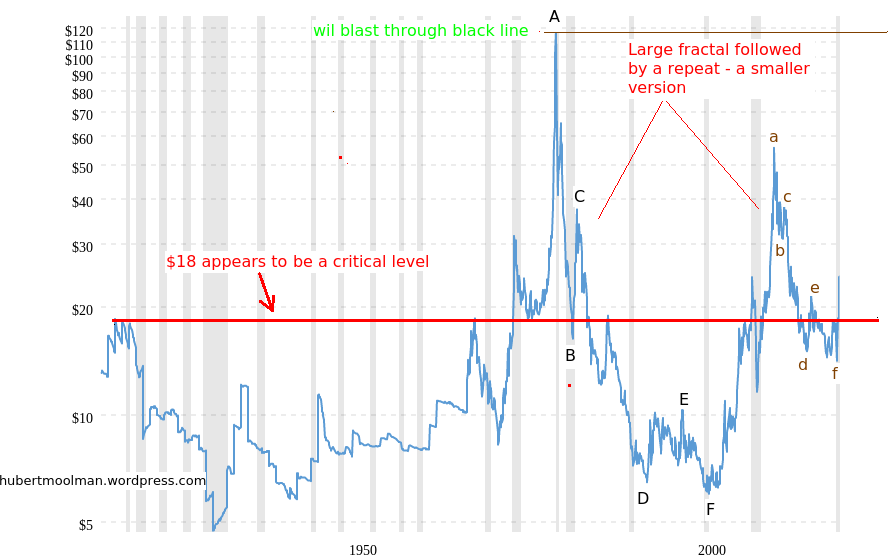 This inflation-adjusted silver chart (from macrotrends.net) tells an interesting story:
[…] The level around $18 appears to have been very critical, especially since it is the 1920 and 1968 inflation adjusted high.
It was an important level to cross on the way to the 1980 high, evidenced by the fact that it came back to that level (after it blast through in Dec 1973) before setting off to that all-time high of $118 ($50 in nominal terms).
It sealed the silver bear market in 1984 when it broke down below the line, and the again in 1987, when it failed right at the line.