

by Rick Ackerman
RickAckerman.com
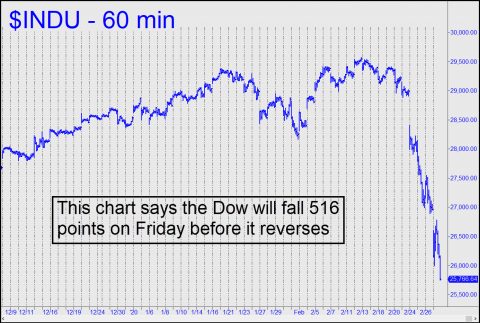 The stock market at its most violent this week has been an easy read, just as it was when the tech sector imploded 20 years ago and during the financial collapse of 2007-08. On the eve of today’s memorable carnage the short-term charts practically glowed with warnings of the Dow’s imminent, record-breaking plunge. I’d predicted as much in commentary sent out the night before, along with targets for the E-Mini S&Ps that caught the exact bottom of one of the best rallies of the year. Subscribers reported getting the profitable ride of their lives in both directions. In the Rick’s Picks Trading Room, where actionable ideas are shared freely 24/7, a few of them said they’d had their best day ever. In some cases this involved getting aboard for the rally at the exact low of the first selling climax in the morning, riding it to within an inch of the mid-day peak, and then surfing the subsequent avalanche into the close. This chart shows how a Coney Island kind of day looked to traders and technicians.