

by Kerry Lutz
Financial Survival Network

Consumer price inflation is a lot like the character of Mike Campbell in Earnest Hemingway’s novel The Sun Also Rises. When asked how he went bankrupt, Mike replies, “Two ways, gradually and then suddenly.” This is exactly what’s happening with inflation; it started out gradually and then suddenly intensified.
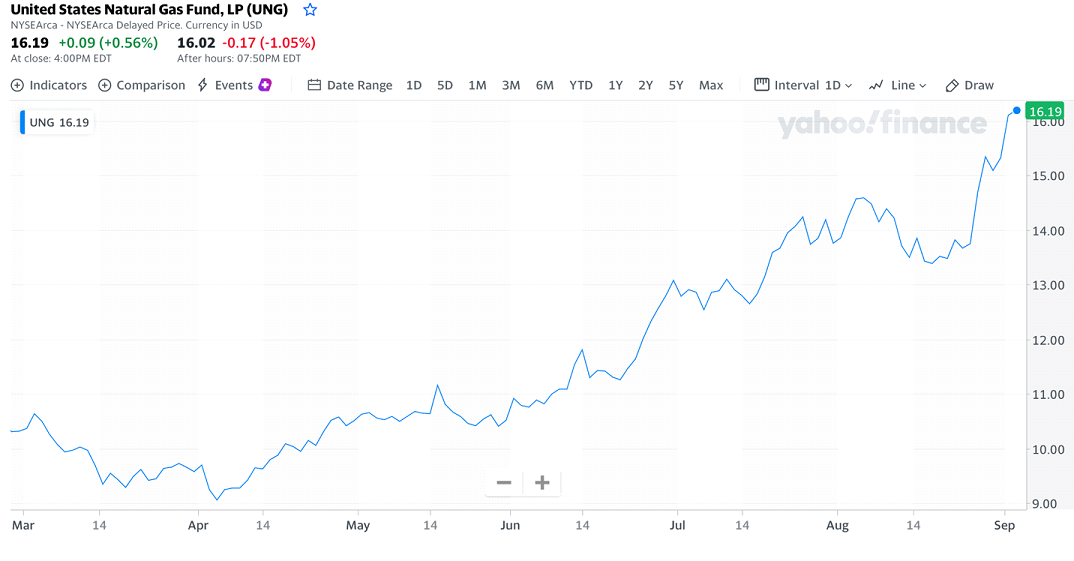
Natural Gas prices have followed that pattern well. This commodity has been energy patch’s red-headed step-child for years. Often referred to as “The widow-maker,” for its propensity to literally drive traders off the ledge, the natural gas price is often an island of stability, interrupted by periods of gut-wrenching volatility. Prior to the recent massive doses of economic stimulus, Natgas had found it hard to catch a bid. Since 2015 and after the advent of the fracking boom, it’s average annual price had floated between $2.62 (2015) to $2.03 (2020) per MMBtu. It closed out 2018 at $3.15, a four-year high. Currently it is trading at the lofty price of $4.72. The UNG ETF appears to be going higher on much higher volume.
It’s an example of yet another commodity, (see below) that has gone exponential.
| Commodity | 1 Month Change | 12 Month Change | Year to Date Change |
| Commodity Agricultural Raw Materials Index | -2.14 % | 10.70 % | -1.43 % |
| Commodity Beverage Price Index | 2.85 % | 18.10 % | 12.07 % |
| Commodity Price Index | 2.80 % | 61.22 % | 20.96 % |
| Commodity Fuel (energy) Index | 4.84 % | 90.74 % | 40.91 % |
| Commodity Food and Beverage Price Index | 0.50 % | 34.58 % | 13.57 % |
| Commodity Food Price Index | -0.93 % | 36.66 % | 6.68 % |
| Commodity Industrial Inputs Price Index | -0.19 % | 61.39 % | 21.37 % |
| Commodity Metals Price Index | 0.20 % | 57.44 % | 21.08 % |
| Commodity Non-Fuel Price Index | -0.18 % | 38.97 % | 11.90 % |
| Crude Oil (petroleum), Price index | 2.96 % | 70.35 % | 38.86 % |
| Coal, Australian thermal coal | 16.93 % | 194.74 % | 75.02 % |
| Coal, South African export price | 8.33 % | 116.13 % | 40.85 % |
| Crude Oil (petroleum) | 2.06 % | 74.19 % | 36.72 % |
| Crude Oil (petroleum); Dated Brent | 1.81 % | 73.77 % | 36.37 % |
| Crude Oil (petroleum); Dubai Fateh | 2.87 % | 71.20 % | 34.79 % |
| Crude Oil (petroleum); West Texas Intermediate | 1.51 % | 77.82 % | 39.08 % |
| Diesel | 0.28 % | 71.53 % | 35.05 % |
| Gasoline | 4.15 % | 85.00 % | 44.40 % |
| Heating Oil | 1.88 % | 64.03 % | 31.82 % |
| Indonesian Liquified Natural Gas | 1.87 % | 25.80 % | 8.89 % |
| Jet Fuel | 1.62 % | 74.08 % | 32.89 % |
| Natural Gas | 17.65 % | 118.39 % | 42.32 % |
| Propane | 12.95 % | 122.00 % | 26.30 % |
| RBOB Gasoline | 2.16 % | 77.79 % | 42.74 % |
| Russian Natural Gas | 21.46 % | 595.00 % | 72.08 % |
| Cocoa beans | -1.69 % | 10.95 % | -2.51 % |
| Coffee, Other Mild Arabicas | 5.90 % | 38.58 % | 26.84 % |
| Coffee, Robusta | 11.23 % | 39.60 % | 33.33 % |
Natural gas serves almost 67 million homes; 5.4 million businesses like hotels, restaurants, hospitals, schools and supermarkets; 192,000 factories; and 1,900 electric generating units. On a daily basis, the average U.S. home uses 196 cubic feet of natural gas. So, the impact of higher natural gas prices will be broadly felt. While electric producers and natgas distributors generally procure their supply through long-term fixed price contracts, not so for most households and businesses. Higher gas prices, together with higher across the board energy prices are going to have a substantial further impact on consumer prices.
All of the above will inevitably lead to higher precious metals prices and higher mining stock prices as well. Since achieving its all-time high on August 7, 2020, gold has been in a bearish consolidation pattern. While higher commodity prices alone may not be enough to send precious metals prices to the moon, the dawning realization that the Fed has lost its mock battle against the rising CPI may very well be the ticket to finally unleash the golden (and silver) genie from its bottle. At that point it will simply become a matter of how high prices can eventually go. And we’ll know for certain when we see the GDX take off ahead of the metals, as the stocks invariably lead the physical metal market higher.
It’s going to be a wild ride, so buckle your seat!
Regards,
Kerry Lutz